
Regardless of your political affiliation, I think we can unanimously rejoice that political advertisement season is behind us! With that in mind, I thought it may be interesting to share a historical perspective on the midterm elections. The Capital Group dug into 85 years of midterm election history and identified some key takeaways that I wanted to share with you.
The first takeaway is that it is common for the President’s approval ratings to decrease the first two years in office. The party not in power becomes frustrated and therefore more motivated to make a change, which typically results in a shift in Congress at the midterm point. “Over the last 21 midterm elections, the president’s party has lost an average 30 seats in the House of Representatives and four seats in the Senate,” according to Capital Group.
The second point they make is that markets have reacted later in midterm years than in all other years, looking at data between 1931 and 2018. Uncertainty about the outcome of the election is more prevalent early in an election year, so investors may not make any big moves. As election results become more predictable nearing the election, markets tend to rally. In the chart, you can see how midterm years have compared with other years:
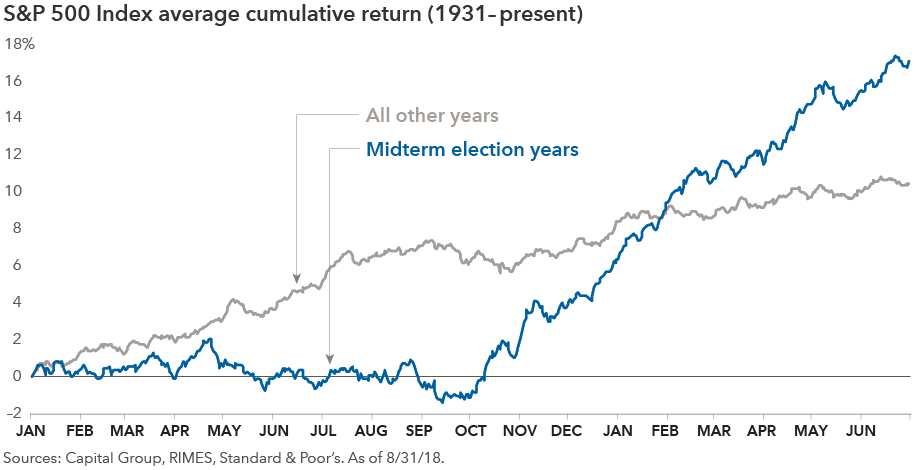
The last takeaway that I thought was particularly interesting was that after midterm elections, markets typically rebound strongly. According to Capital Group, “Since 1950, the average one-year return following a midterm election is 15%, more than double that of all other years during a similar period.”
With any luck I truly hope that the trend that has persisted in the past continues over the remainder of the twelve month period following midterm elections. However, my knowledge tells me that making a bold bet on this outcome is narrow-sighted, as the investing world is littered with patterns that fail to persist into the future. For this reason, we do not make aggressive moves on historical research because unlike other aspects of the universe, history does not always repeat itself in the investing markets.
The S&P 500® is a market capitalization-weighted index of large-cap U.S. equities. The index includes 500 leading companies and captures approximately 80% coverage of available market capitalization. Source: us.spindices.com/indices/equity/sp-500.
Any reference to a market index is included for illustrative purposes only, as it is not possible to directly invest in an index. Indices are unmanaged, hypothetical vehicles that serve as market indicators and do not account for the deduction of management fees or transaction costs generally associated with investable products, which otherwise have the effect of reducing the performance of an actual investment portfolio.